Thang Tran

Business Data Analyst

Thang Tran headshot

Turning messy data into clear decisions with SQL, Python (pandas), and BI (Power BI / Tableau).

About Me

Welcome to my website! I’m Thang Tran, a UMass Lowell graduate with a degree in management information system. I am a data driven problem solver and my work turns complex data into clear, actionable insights and story-driven dashboards. Through my co-op at Lightforce Orthodontics and multiple analytics projects, I’ve gained hands-on experience with SQL, Python, Power BI and Tableau. I love learning! If you have any suggestions for my site please let me know! I hope we can meet soon!

Get in Touch

Projects

Selected work with outcomes. Ask for code samples or deep-dive writeups.

Featured

Census Data Analytics Pipeline - U.S Education & Income Trends

PythonPower BIExcelAWS (S3 & Athena)SQL
Census Data Analytics Pipeline - U.S Education & Income Trends screenshot

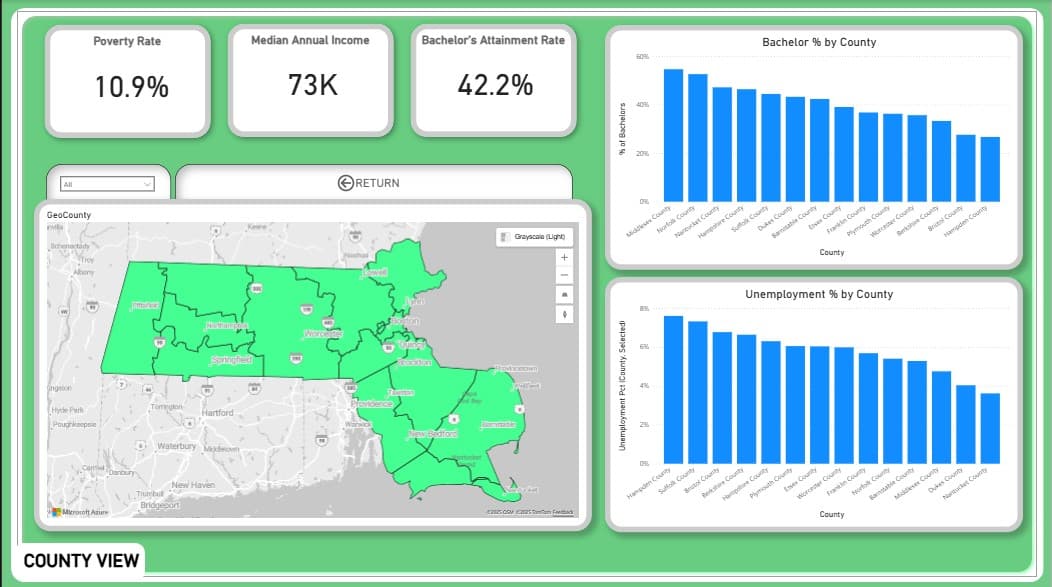
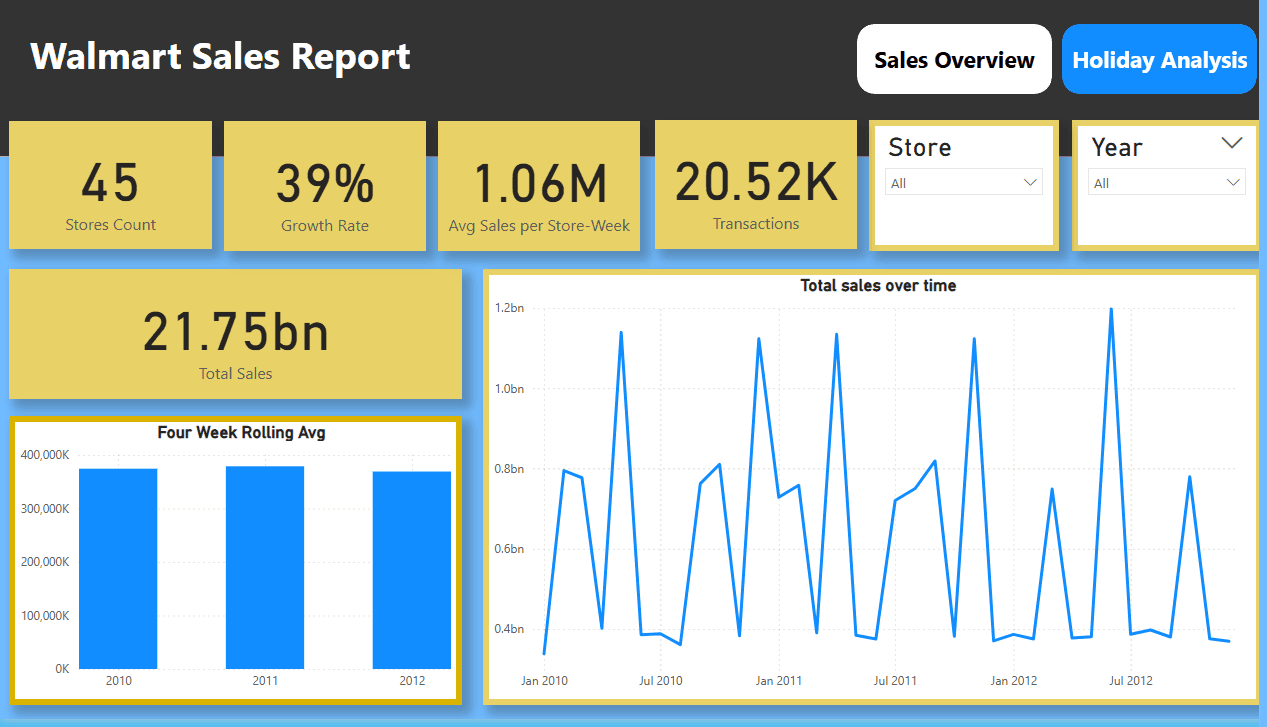
Built an interactive Power BI dashboard using AWS Athena census data (2015–2020) to examine how education levels affect income and poverty across the U.S., revealing that regions with more college graduates have higher incomes and lower poverty rates, while many Southern and rural areas still lag behind.

Holiday Impact on Retail Sales

PythonPower BIExcelSQL
Holiday Impact on Retail Sales screenshot

Enabled managers to monitor $21.7B sales as data across 45 stores, improving visibility into profitiability trends for holiday season. Authored an end to end retail analytics pipeline with SQL Server, Processed and transformed 6,000+ rows with SQL bulk inserts and star schema modeling, type safe SQL in order to designed and deliver a clean interactive Power BI model with multiple pages showing analytics on real world data such as growth rate, total sales over time.

Healthcare Insurance Cost Analysis

PythonPandasExcelGithubPlotlyStreamlit
Healthcare Insurance Cost Analysis screenshot

Built a interactive data dashboard to explore how traits influence healthcare insurance charges. Performed data cleaning and exploratory data analysis on real world insurance data using Pandas and Seaborn/Plotly. Implemented multiple filters for users to inreactively explore the data with a streamlit sidebar. Deployed using Streamlit cloud and github for public access.

Experience

Roles where I delivered measurable impact.

Contact

Want to talk about an opportunity or a project? Reach out! I’m based in the Greater Boston area and open to roles.